
-
Bus
-
Business Intelligence
-
Business Intelligence Overview
-
AVM®
Vehicle health monitoring solution
-
CleverAnalytics™
Diagnose inefficiencies with targeted reports
-
CleverInsights
Ridership reporting made easy
-
CleverMetrix
Real-time reporting dashboards
-
CleverReports®
Business intelligence reporting suite
-
Occupancy Management
Monitor and control passenger loads
-
Business Intelligence Overview
-
Communications
-
Fleet Management
-
Operations Control
-
Planning - Scheduling - Operations
-
Real-Time Passenger Information
-
Safety and Security
-
Yard and Asset Management
-
Cloud Hosting
-
Business Intelligence
-
Rail
-
Paratransit
MAIOR: Service Planning
Define and manage your network in detail, plan your trips, optimize timetables, and improve planning accuracy and on-time performance with the MAIOR Suite's Service Planning modules.
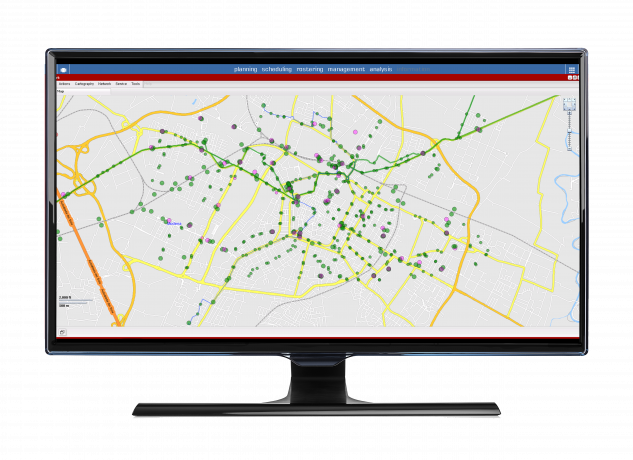
Network Design
Define and manage your transit network in detail
Plan your routes quickly and effectively and easily keep your transit network up to date.
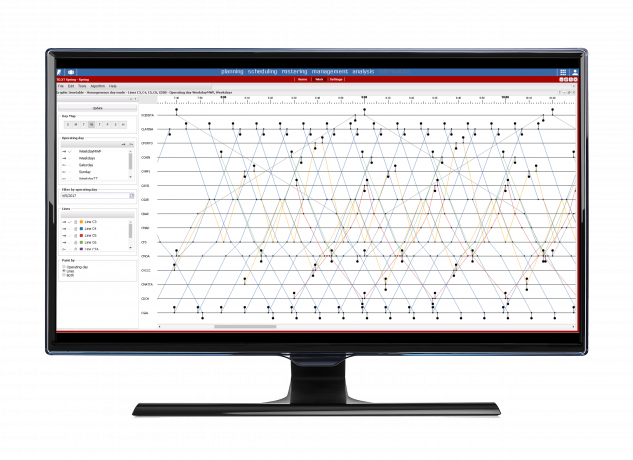
Timetable Design
Optimize your timetables and meet riders’ needs
Optimize the design of your timetables; address headway goals, manage vehicle availability, interlining, calendar management, and meet passenger demand.
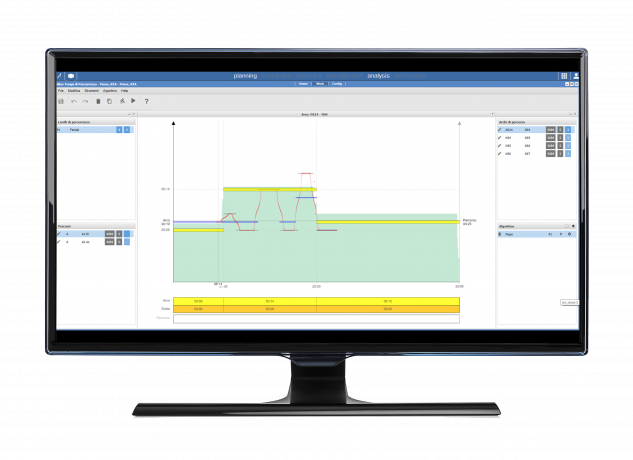
Run Time Analysis
Improve your on-time performance and service reliability
Leverage your historical CAD/AVL data to calculate optimal run times throughout the day to improve service reliability and improve your on-time performance.
KITSAP TRANSIT REDUCES COSTS AND IMPROVES OPERATIONAL EFFICIENCY WITH MAIOR
Before MAIOR, Kitsap Transit located in the Pacific Northwest was manually managing its planning and scheduling. The process was inefficient and time-consuming. Watch the video and learn how Clever Devices helped Kitsap align their planning and scheduling departments and improve the overall scheduling process for the agency.
A Tailor-Made Scheduling Solution as Unique as Your Agency
Download the eBook
The MAIOR Transit Scheduling Suite is a powerful and integrated software solution that simplifies and optimizes your planning and scheduling process to ensure that you are creating reliable service in the most economical manner possible. Download our latest to eBook to learn more.
Download the eBookQuick Links
MAIOR Suite: Resource Scheduling
Optimize the creation of your vehicle and operator schedules to ensure maximum efficiency. Simultaneous blocking and run cutting generates schedules that optimize vehicles and drivers and reduce the number of blocks and duties required to perform your service, saving time and money.
Learn MoreMAIOR Suite: Operations Management
Manage the unpredictable changes that occur every day and make better decisions based on optimized and shared data across your ITS system.
Learn MoreRelated Solutions
The MAIOR Suite
The MAIOR Suite is a powerful and integrated solution that simplifies and optimizes your service scheduling process to ensure that you create reliable service in the most economical and efficient manner possible.
See MoreClever Devices uses cookies on our website to, among other things, fulfill user requests, provide enhanced functionality for our users, and enhance web content. If you continue to use this site, you agree that we can place these types of cookies on your device. For more information, please review our Privacy Policy.
Accept